Whether you’re a new or experienced investor, you must have heard the term P/E ratio (Price-to-Earnings ratio) as a tool to gauge the valuation of stocks. Just like individual stocks have their own P/E ratios, broad market indices such as Nifty 50 and Nifty 100 also have a P/E ratio, which indicates how fairly valued the markets are at any given time. This broad market valuation can help you decide whether to buy, hold, or sell your holdings. In this post today, I will help you understand how to determine the perfect Price-to-Earning ratio for Nifty 50 index and take your buy, hold, or sell calls effectively.
Is there a “Perfect PE” ratio for Nifty?
Good stocks with a P/E ratio of 15 or less are seen as undervalued and could be a great buy opportunity. But does the same kind of simple yardstick or benchmark exist for the Price-to-Earnings ratio of Nifty 50 also? Well, not quite. That’s because the ideal Nifty P/E ratio—what we’re calling the ‘sweet spot’ in this post—depends on a bunch of factors, like investor sentiments and historical data.
Historical perspective: What does the last 10 years of Nifty 50 data tells us?
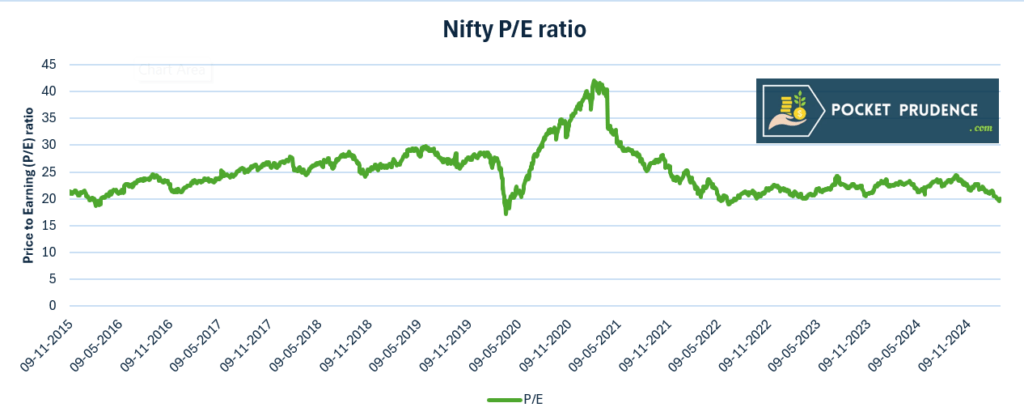
I visited the National Stock Exchange’s official website and crunched some numbers for you. The analysis focuses on the Price-to-Earnings (P/E) ratio of the Nifty 50 index over the past 10 years, with data available starting from November 9, 2015. Let’s understand this analysis with the help of this chart:
Interesting facts!
- Lowest Nifty P/E , so far: 17.15 (23/03/2020). Reason – Covid-19
- Average Nifty P/E ratio: 24.96 (last 10 years data)
- Highest Nifty P/E ratio: 42 (08/02/2021)
The average P/E ratio for the Nifty 50 during this period comes out to be 24.96x. With the current P/E ratio at 19.96x, this clearly suggests that the markets are relatively undervalued right now. Therefore, this could be a good opportunity to invest in high-quality stocks that have correctly sharply from their all-time highs. And if you’re someone who leans toward passive investing—like I sometimes do—this might be a smart moment to add more to your index fund portfolio.
Understanding the concept of Price to Earnings ratio
The average P/E ratio of 24.96 reflects the average P/E ratio of the 50 large-cap companies that make up the Nifty 50 index. But I’ve got a question for you—do you fully grasp what a Price-to-Earnings ratio really means?
Let me break it down for you in simple terms.
Essentially, it’s the number of times the market is willing to pay for every rupee of a company’s earnings. For example, if a stock, say TCS is trading at a P/E multiple of 26, it suggests that the market is currently willing to pay 26 times for each rupee that TCS earns.
Mathematically:
P/E ratio = current market price / Earnings per Share (EPS)
Earnings per Share = (Net income after tax - preferred dividend) / Total number of outstanding shares.
Investors’ psychology and Nifty P/E ratio
We now know how the data and charts help determine the average P/E ratio of Nifty. But there’s more to it than just the historical numbers. The broad market psychology has the potential to push the Nifty P/E ratio up or down, beyond the stock fundamentals and macro/micro economic factors. It’s fascinating to know how much the market psychology plays into this.
When optimism is running high—like during a bull market—you’ll often see investors willing to pay a premium, driving that Nifty P/E multiple higher. It’s almost like the market’s saying, “I’m betting big on the future!” That’s when you might spot P/E ratios of all broad market indices, including Nifty 50 climbing well above the average, reflecting confidence in strong earnings down the road.
On the flip side, fear or uncertainty—like during a downturn—can pull the P/E ratio down. When you and other investors start feeling cautious, perhaps because of economic slowdowns or global jitters (think a new virus, the Russia-Ukraine war, Trump tariffs, or similar events), the market’s willingness to pay for each rupee of earnings takes a hit. Suddenly, a Nifty P/E ratio of 19.96, like we’re seeing now, begins to look like a bargain.
It’s not just about the raw data, though—it’s about how you and I, along with millions of others, perceive the road ahead. Market sentiments can either boost or soften what the numbers tell us. I therefore believe that keeping a pulse on that mood is just as important as studying the charts.
Striking the Balance: Mixing Data with Market Psychology
So, you’ve got the numbers and you’ve also got the feel of market sentiments. But how do you tie it all together to decide when to buy, hold, or sell?
I think it’s about blending the hard data with the psychology at play. This essentially has to start with the stats: a lower Nifty P/E ratio, like we’re seeing now, might signal undervaluation, compelling you to buy. But I would say – don’t jump in just yet. You’ve got to dig deeper and ask, “What’s behind this number?”
- If it’s a solid dip with fundamentals and earnings intact, it signals a solid buy call.
- If fear—like over a global trade war or a new virus—is tanking sentiment, maybe you should hold steady and wait it out. Buying the dips can look tempting, but I’ll warn you—it might turn into catching a falling knife if the drop keeps going.
- Contrary, if optimism is soaring and the P/E is climbing in spite of poor fundamentals and earnings, you might sell if the numbers hint at overvaluation. Otherwise, you can hold if you believe the growth has still got legs.
What’s your call?
I would like to hear from you now. Do you take the P/E ratio of Nifty into consideration while taking investment decisions? What factors do you consider? Please drop your comments below.
Such a clear explanation! I’ve been nervous about buying dips, but this gives me a nudge to watch sentiment too. Great stuff!
This was so helpful! I do peek at the P/E, but global events freak me out more. Do you ever override the numbers based on gut feel?
Hey Kiara, that’s a tough one! Yes, I do override the numbers with gut feel sometimes. Emotions and market sentiment can get so intense that they outweigh the data. For instance, back in 2020 during the COVID crash, the Nifty P/E dropped like a rock, and the numbers screamed ‘buy.’ But I held off—panic was everywhere, and my gut told me to wait for the dust to settle. Turned out I dodged a deeper dip! It’s not foolproof, but sometimes that instinct kicks in hard. What’s your take on trusting your gut?